What do schools really think about their MIS in 2023?
Annual analysis of over 1,000 schools
Schools deserve the support of the best possible technology so they can thrive, and the all-important management information system (MIS) sits at the core of this. An effective MIS democratises data to aid good decision making about everything from effective seating plans to school improvement priorities, makes it easier to connect with parents and carers (through communication apps), and facilitates the multitude of organisational admin that keeps the wheels turning on everyday activities (such as school dinners and trips).
Each year, we run a survey to learn the latest from the sector on what schools feel about their MIS. For a third year, we've explored the experiences of users of the top 5 providers by market share: Arbor, Bromcom, Integris (formerly RM Integris), ScholarPack and SIMS. Our objectives were to understand what schools want from their MIS provider, whether they feel their current provider is living up to these expectations, and whether they’re considering switching in the next year.
As we delved into the results, we were mindful of the impact of high workloads on recruitment and retention in the sector, and the potential of an effective MIS to reduce workload across the school ecosystem. And so we were especially keen to see what the latest data might show on how getting the right MIS can help schools to become more efficient, and ultimately improve the working lives of those people working in education.
1,105 people answered this latest survey in June and July 2023, including 1,040 users from the top 5 brands by market share, with over 100 responses from each of these brands. Due to the smaller number of schools purchasing alternative brands, we weren’t able to achieve a large enough sample size of these customers to ensure robustness - so we’ve not drilled down beyond the 5 providers listed above (please see our sample breakdown and survey methodology at the end of this blog post).
A note for transparency: The Key, which ran this survey, and 3 of the MIS providers used by schools in this survey (Arbor, Integris, and ScholarPack), are all part of The Key Group. As a group, The Key Group prioritises listening to schools and their needs, and believes in the ability of best-in-class tech products to transform schools for the better. At The Key, our aim is that the findings of this survey will help inform those leading on MIS decisions for their school. In this blog post, we endeavour to present an objective summary of the survey results without additional commentary, to avoid risk of bias.
Generally, how satisfied are schools with their MIS?
When asked for their MIS satisfaction rating on a scale of 1 to 10, responses varied – with the majority falling on the upper, more ‘satisfied’ half of the scale.

Graph 1 - “How satisfied are you with your MIS? Please select a score from 1 to 10, where 1 is ‘Extremely dissatisfied’ and 10 is ‘Extremely satisfied’”, base = 1,105 respondent
If we think of a rating of 9 or 10 as being ‘extremely satisfied’, more than 1 in 5 of the total respondents told us that this is how they feel about their MIS. Fewer than 1 in 10 of total respondents reported an ‘extremely dissatisfied’ score of 1 or 2.
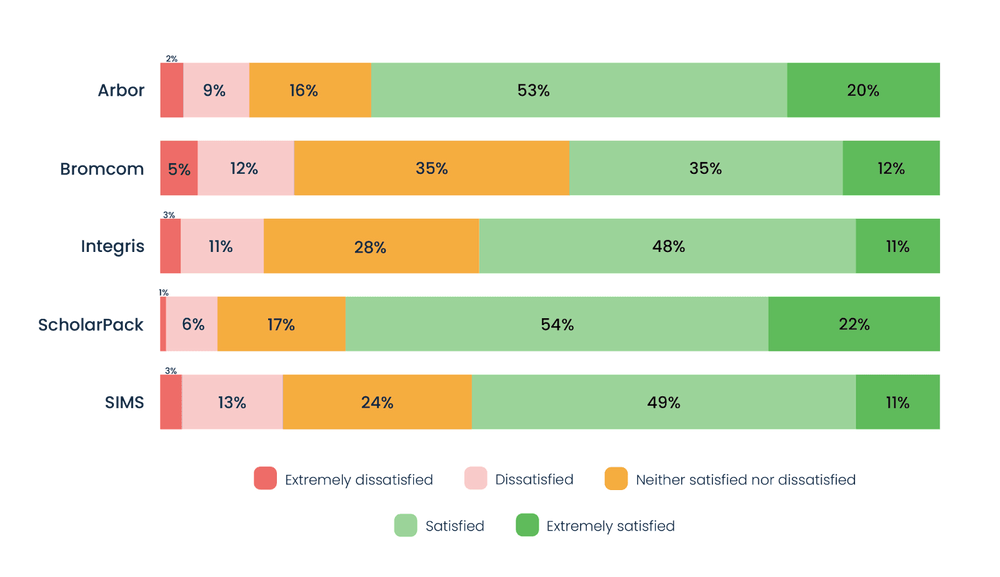
Breaking this down for the top 5 MIS providers by market share (see graph 2 below), Arbor and ScholarPack appear to be tied in terms of the highest percentage of respondents rating their MIS as either a 9 or 10 in terms of satisfaction (both at 35%). 26% of Integris users surveyed also selected either of these top 2 scores, and Bromcom and SIMS each have 12% of surveyed users rating their satisfaction as a 9 or 10. Represented as averages, the overall satisfaction scores of survey respondents are 7.9 for ScholarPack, 7.6 for Arbor, 7.2 for Integris, and 6.0 for both Bromcom and SIMS.
Interestingly, average general MIS satisfaction scores were marginally higher for respondents from maintained schools (7.0) than academies (6.4). Among the school roles for which we received over 100 respondents, there was little variation in general satisfaction scores with their MIS; they ranged from an average score of 6.5 for headteachers, to 7.1 for school business managers.

Graph 2 - “How satisfied are you with your MIS? Please select a score from 1-10, where 1 is ‘Extremely dissatisfied’ and 10 is ‘Extremely satisfied’”, base - 1,040 respondents from the top 5 MIS providers by market share
How satisfied are schools with various aspects of their MIS?
Intuitiveness for new users
An MIS is like the engine room of a school, and is used by staff across a setting – from office staff to premises managers, support staff, teachers and leadership teams. For anyone joining a school with a different MIS to the one they’ve used previously, the ability to get up and running on the MIS quickly is crucial for reducing their workload and increasing their confidence in the new setting. Equally, for schools changing MIS, the switch should be as seamless as possible to make sure the day-to-day running of the school or trust isn’t disrupted, and to enable the democratisation of data as soon as possible.
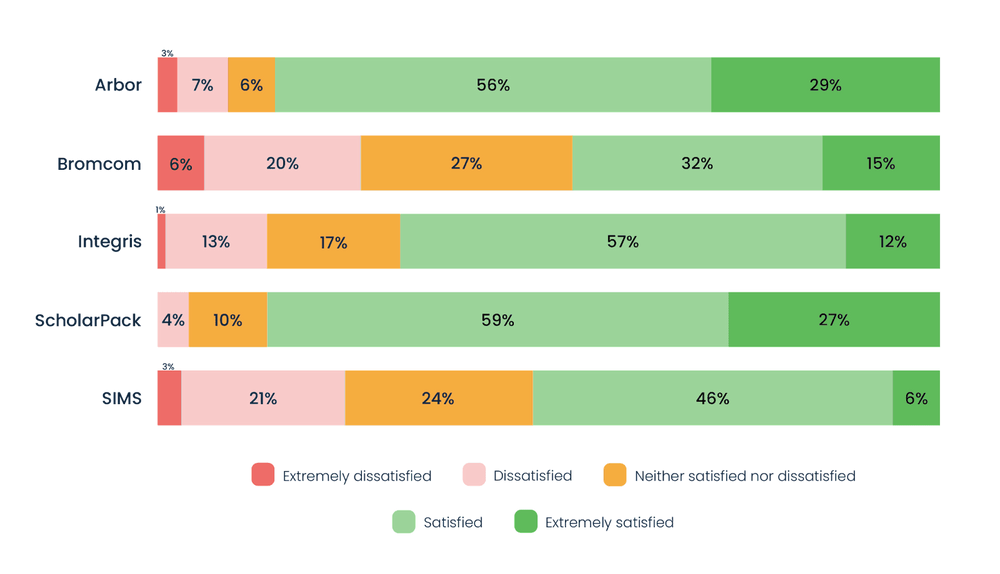
Overall, 12% of the total survey respondents reported being ‘extremely satisfied’ with how intuitive their MIS is for new users. Graph 3 shows that Arbor and ScholarPack appear to have the highest satisfaction rating here, with 30% and 29% of users respectively saying they are ‘extremely satisfied’ with how intuitive their MIS is for new users – compared with 6% of those from Integris, 6% from Bromcom and 3% from SIMS.

Graph 3 - “How satisfied are you with how intuitive the MIS is for new users?”, base = 1,040 respondents from the top 5 MIS providers by market share
The extent to which to the MIS integrates with other systems and software
How well any new technology integrates with existing systems and software can make the difference between successful whole-scale adoption, and frustration. 1 in 10 of total survey respondents cited ‘integration with other products’ as the most important factor to consider when switching MIS (see graph 13). We asked those working in schools to rate their satisfaction with the integration of their MIS with their other systems and software, and, overall, 62% reported being either ‘satisfied’ or ‘extremely satisfied’.
Broken down by the top 5 providers by market share (graph 4), ScholarPack came out on top, with 76% of its users reportedly feeling either ‘satisfied’ or ‘extremely satisfied’ with its integration. This was followed closely by 73% of users from Arbor, 60% from SIMS, 59% from Integris and 47% from Bromcom.
Graph 4 - “How satisfied are you with the extent to which to MIS integrates with other systems/software?”, base = 1,040 respondents from the top 5 MIS providers by market share
Functionality of the MIS
Functionality was selected as the most important factor when looking for a new MIS by almost two thirds (62%) of our respondents (see graph 13). On average, 63% reported being ‘satisfied’ or ‘extremely satisfied’ with the functionality of their MIS.
Ratings were highest among surveyed users of ScholarPack and Arbor, with the vast majority, 86% and 85% respectively, reporting themselves to be either ‘satisfied’ or ‘extremely satisfied’ with its functionality (see graph 5). This was followed by surveyed users of Integris (69%), SIMS (52%), and Bromcom (47%).
Graph 5 - “How satisfied are you with the functionality of the MIS?”, base = 1,040 respondents from the top 5 MIS providers by market share
The quality of support received
Schools have various options for getting day-to-day support with their MIS. Whether through direct assistance from the MIS provider, or third-party agencies such as local authority teams or independent organisations, the quality of support available remains a consideration when switching MIS (see graph 13).
In graph 6, we can see that the percentage of ‘satisfied’ or ‘extremely satisfied’ users, in terms of support, is highest among ScholarPack users surveyed (79%), followed by Integris (75%) and Arbor (71%), compared to the average of 62% of total respondents reportedly feeling this way. These ratings are significantly higher than for surveyed users of SIMS and Bromcom (at 57% and 44% respectively giving these top ratings).
Graph 6 - “How satisfied are you with the quality of support received?”, base = 1,040 respondents from the top 5 MIS providers by market share
The extent to which the MIS provides actionable information
The relationship between school staff and their MIS shouldn’t just be one-way, with staff inputting data and getting nothing back. A government report investigating factors affecting teacher retention found that teaching staff reported feeling ‘overwhelmed’ by the amount of data tracking expected, which contributes to an ‘unsustainable’ workload. Ideally, the MIS should be an invaluable time-saving tool for staff to better understand their pupils, correlating data for them on everything from progress and attainment, attendance, special educational needs and disabilities (SEND), behaviour and more.
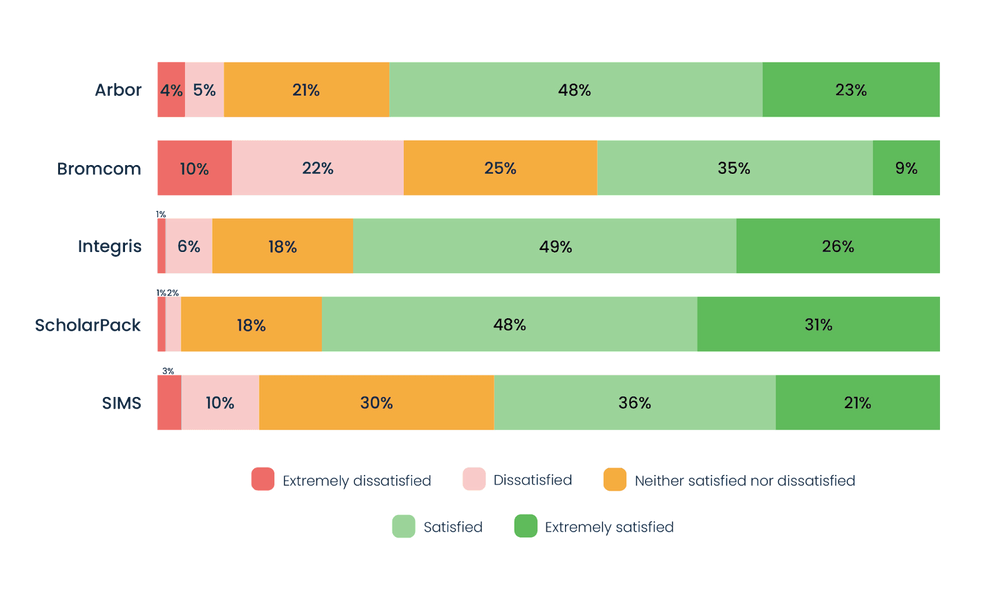
Overall, 53% of respondents from the top 5 providers by market share reported being ‘satisfied’ or ‘extremely satisfied’ with how well their MIS provides information they can act on. In graph 7, we can see that ScholarPack (78%) and Arbor (75%) users surveyed were the most likely to say they were ‘satisfied’ or ‘extremely satisfied’ with the ability of their MIS to provide them with actionable information. 62% of Integris users surveyed also reported this, along with 41% of Bromcom users and 40% of SIMS users.

Graph 7 - “How satisfied are you with the extent to which your MIS provides actionable information?”, base = 1,040 respondents from the top 5 MIS providers by market share
How effective is the MIS at providing various benefits?
It’s widely accepted that schools should be able to use their MIS to save time with manual data processing, to support them in extracting data to perform tasks, and to help them collaborate with colleagues (whether that be around shared access to data, or how data is surfaced and analysed to enable collaboration – for example, between the pastoral team and attendance officer).
We asked all of our respondents how well they felt their MIS provides these benefits (graph 8), and nearly a quarter (24%) reported that they don’t feel their MIS saves them time, nearly 2 in 10 (18%) don’t feel it gives them the data they need to do their job well, and over a third (34%) don’t believe their MIS helps them to collaborate with colleagues.

Graph 8 - “How effective is your MIS at providing you with the following benefits?”, base = 1,105 respondents
It saves me time
When looking just at the metric of ‘time saving’ (graph 9), if we break it down by the top 5 brands by market share, ScholarPack and Arbor come out on top, with 27% and 25% (respectively) of their users surveyed saying that their MIS is ‘extremely effective’ at saving them time. This compares to 6% of Bromcom and Integris users surveyed, and 3% of SIMS users.

Graph 9 - “How effective is your MIS at saving you time?”, base = 1,040 respondents from the top 5 MIS providers by market share
It gives me the data I need to do my job well
Whether it's the dedicated data managers and office administrators who rely on their MIS for the majority of their workday, or the teachers seeking prompt access to records on SEND, the MIS and the data it holds is at the heart of school operations.
In graph 10, we see that Arbor and ScholarPack users surveyed were most likely to say that their MIS is ‘extremely effective’ at giving them the data they need to do their job well (22% and 20% respectively). This compares to 9% of Integris, 9% of Bromcom and 5% of SIMS users surveyed.

Graph 10 - “How effective is your MIS at giving you the data needed to do your job well?”, base = 1,040 respondents from the top 5 MIS providers by market share
It helps me to collaborate with colleagues
Schools collect multiple pieces of data on a pupil – including on communications with parents and carers, behaviour incidents, homework completion, SEND, attendance and more – and being able to analyse that data, as a team, allows for collaboration on solutions. An MIS is instrumental in supporting this to happen easily.
Graph 11 shows that Arbor users surveyed were the most likely to say that their MIS is ‘extremely effective’ at helping them to collaborate with colleagues (17%). This is followed by 11% of users surveyed from ScholarPack, 7% from Bromcom, 5% from Integris and 3% from SIMS.

Graph 11 - “How effective is your MIS at helping you to collaborate with colleagues?”, base = 1,040 respondents from the top 5 MIS providers by market share
How likely are schools to consider changing their MIS provider in the next 12 months?
The decision to change MIS provider is a significant one for schools. The 2021/22 academic year saw record numbers of schools switching their MIS (2,291 schools), according to school census data, followed by 2,007 schools this past academic year – and our findings suggest the switching trend isn’t slowing down.
This is the third year we've asked about people’s intentions to switch MIS in the next 12 months (graph 12), and the proportion of those ‘likely’ and ‘very likely’ to switch has continually increased – from 6% and 8% respectively in 2021, to 7% and 9% in 2022, to 11% and 11% in 2023. This is despite those having switched during these years being presumably less interested in switching again so soon (i.e. the idea that the ‘pool’ is likely to be shrinking year-on-year).
Overall this year, almost a quarter (22%) of respondents report that they are considering changing their provider over the next year. Over a third (33%) of SIMS users report being ‘likely’ or ‘very likely’ to switch, compared to 22% in 2022, and 17% in 2021. This compares to 21% of users surveyed from Integris, 18% from ScholarPack, 15% from Bromcom and 4% from Arbor.
It’s worth noting that the green in the graph below, in some cases, could also indicate that schools are tied into multi-year contracts or MAT-wide contracts, and so are unable to switch.

Graph 12 - “How likely are you to consider changing your MIS provider in the next 12 months?”, base = 1,040 respondents from the top 5 MIS providers by market share
We performed a further analysis on this question, to see if there were any other scores in the survey that were more or less likely to predict the likelihood of switching provider. The results showed the 3 most statistically significant predictors of a school planning to change their MIS in the next 12 months to be a lack of:
Intuitiveness for new users
Functionality
Ability to provide actionable information
What’s the most important factor for users in a new MIS provider?
We wanted to understand what’s at the top of schools’ MIS priority lists. As mentioned earlier in this post, this appears to be functionality – graph 13 shows that 62% of respondents chose this as their most important factor when considering switching providers. Perhaps unsurprisingly, given the current financial climate and pressures in the sector, price has become a more important factor, with 20% of respondents citing the price fitting their budget as the most important factor, compared to 16% last year.

Graph 13 - “What is the most important factor when looking for a new MIS supplier?”, base = 1,105 respondents
A note on our methodology
The Key sent this survey to all primary, secondary and special schools, as well as pupil referral units (PRUs), in England, via email. The survey ran from 20 June to 10 July 2023, and asked the same questions as previous surveys run by The Key in July 2022 and April 2021.
1,105 people responded to the survey, including 1,040 users from the top 5 MIS providers by market share:
460 SIMS users (42%)
199 Arbor users (18%)
149 Integris users (14%)
127 ScholarPack users (12%)
105 Bromcom users (10%)
According to the school census in January 2023, across the whole sector: SIMS holds 55% market share, Arbor 17%, Integris 9%, ScholarPack 8%, and Bromcom 8%. This means that the data from our survey appears to be broadly representative of the market.
We also gathered data from schools using Advanced Learning, IRIS Ed:gen, iSAMS, Juniper Horizons, Pupil Asset, and SchoolPod - although these sample sizes were too small to break down. We’ve only included breakdowns by provider where there are at least 100 responses.
Our sample included 708 respondents working in primary schools, 288 in secondary schools, 70 in special schools, 19 in all-through schools, 14 in PRUs and 6 from middle schools. 434 of these respondents were reportedly working in academies, and 626 were in maintained schools. In terms of roles, where available, our survey received responses from:
146 headteachers
186 assistant/deputy headteachers
177 middle leaders
573 office staff, including school business managers
The data has not been weighted by provider, nor has it attempted to be representative by phase, role, type of school or region.